'%3e%3c/path%3e%3c/svg%3e)
4 new question types are here.
We’ve added four new question types to Peekator, giving you more ways to bring UX research directly into your surveys and understand how people organise information, navigate websites, react to first impressions, and interact with designs.
Here’s what’s new and how each one works.
Card Sort
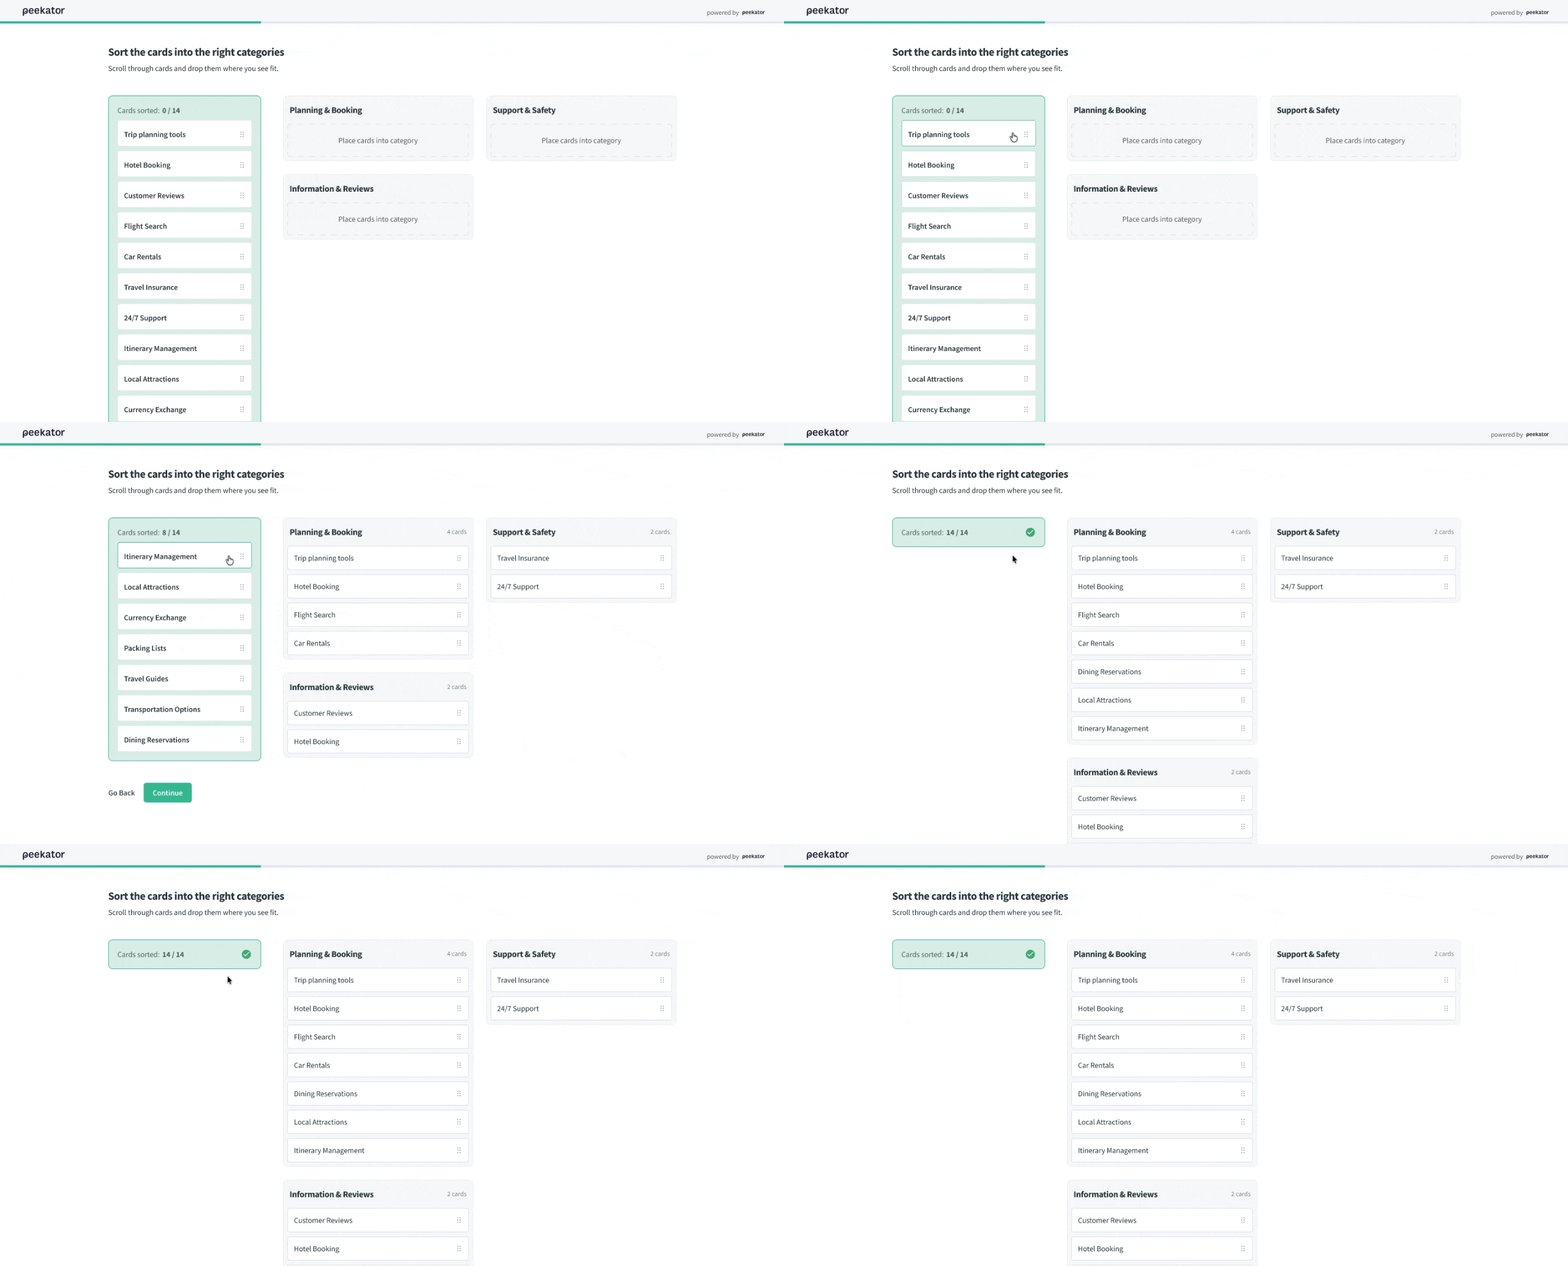
Card Sort helps you understand how people naturally group and organise information. You give respondents a set of cards and ask them to sort them into categories. You can define those categories yourself, or let respondents create their own.
You can also define where you expect each card to go and then track how many respondents sorted them correctly. It’s particularly useful for testing website navigation, content structures, product or service categories, or simply understanding how people expect information to be organised.
Website Test
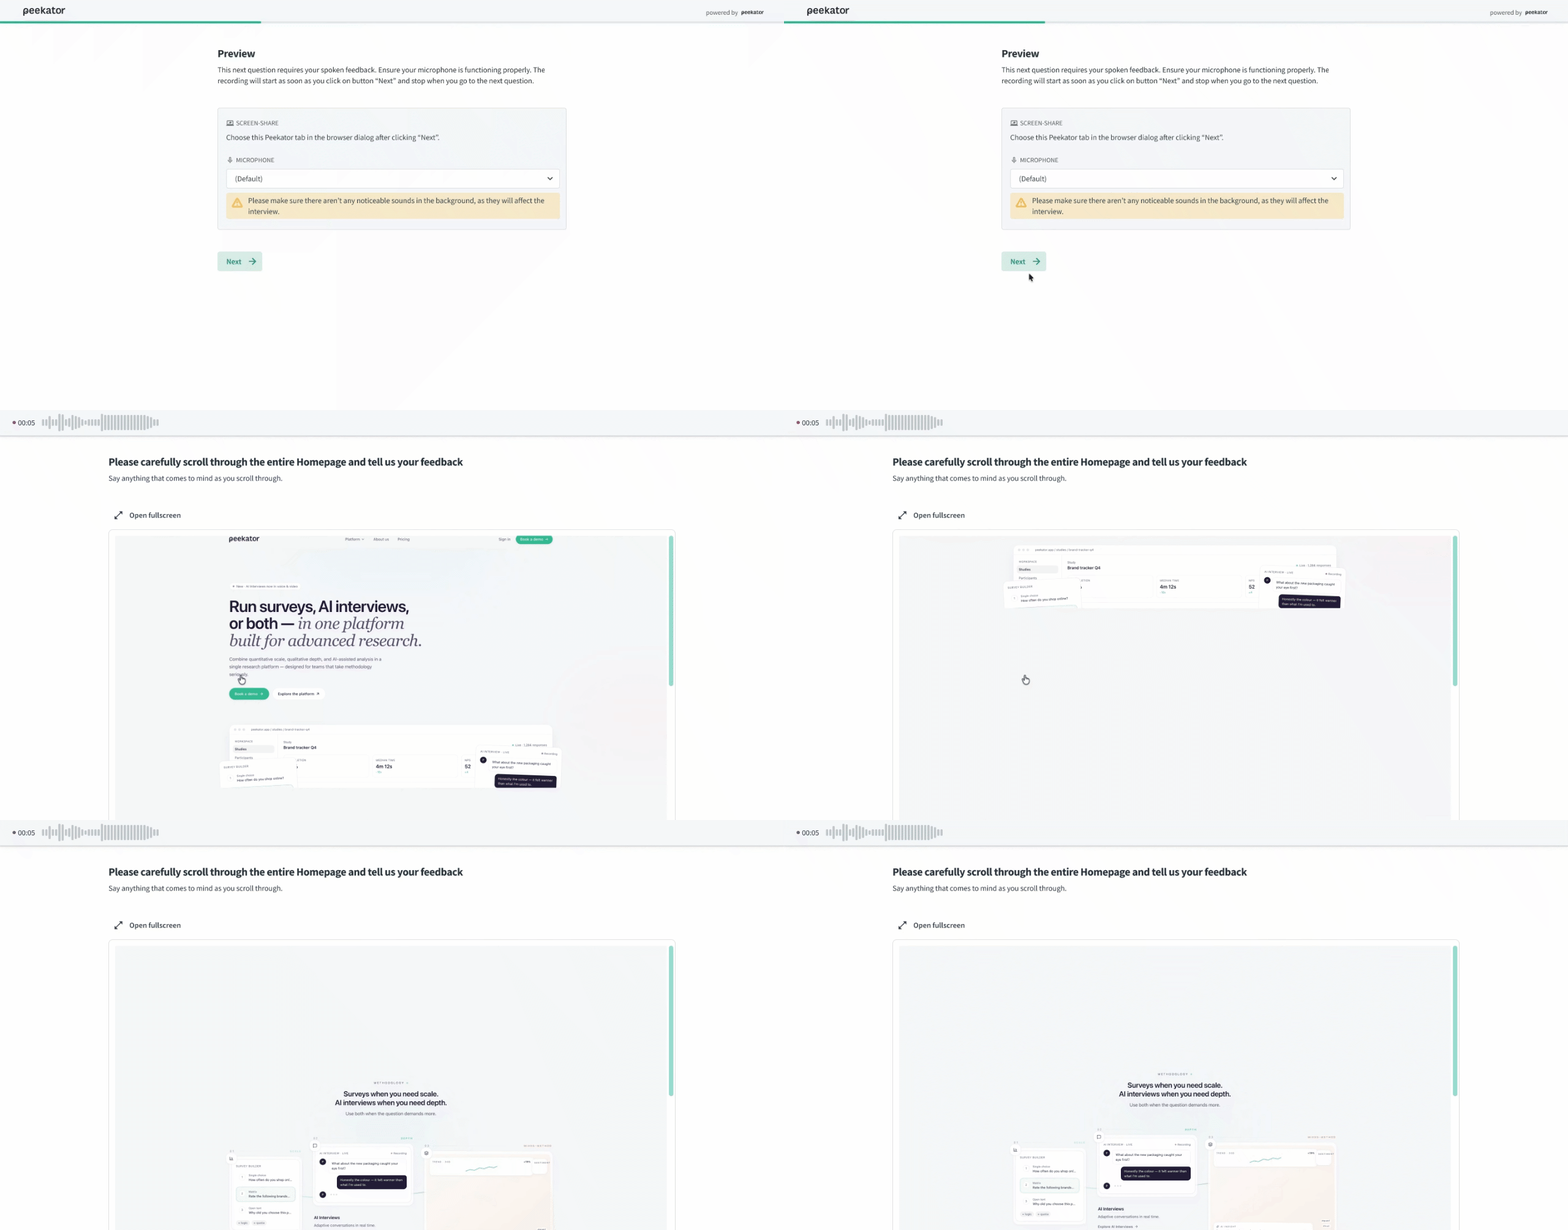
With Website Test, respondents can browse a website directly inside the survey. There’s no need to open another tab or leave the survey. While they browse, they can record their voice and talk through what they’re thinking in real time. What are they looking for? What’s confusing? What do they expect to happen next?
You can also run the test without audio if you simply want respondents to complete a task and answer questions afterwards. It gives you a way to observe the website experience and collect feedback around it, all within the same study.
5 Second Test
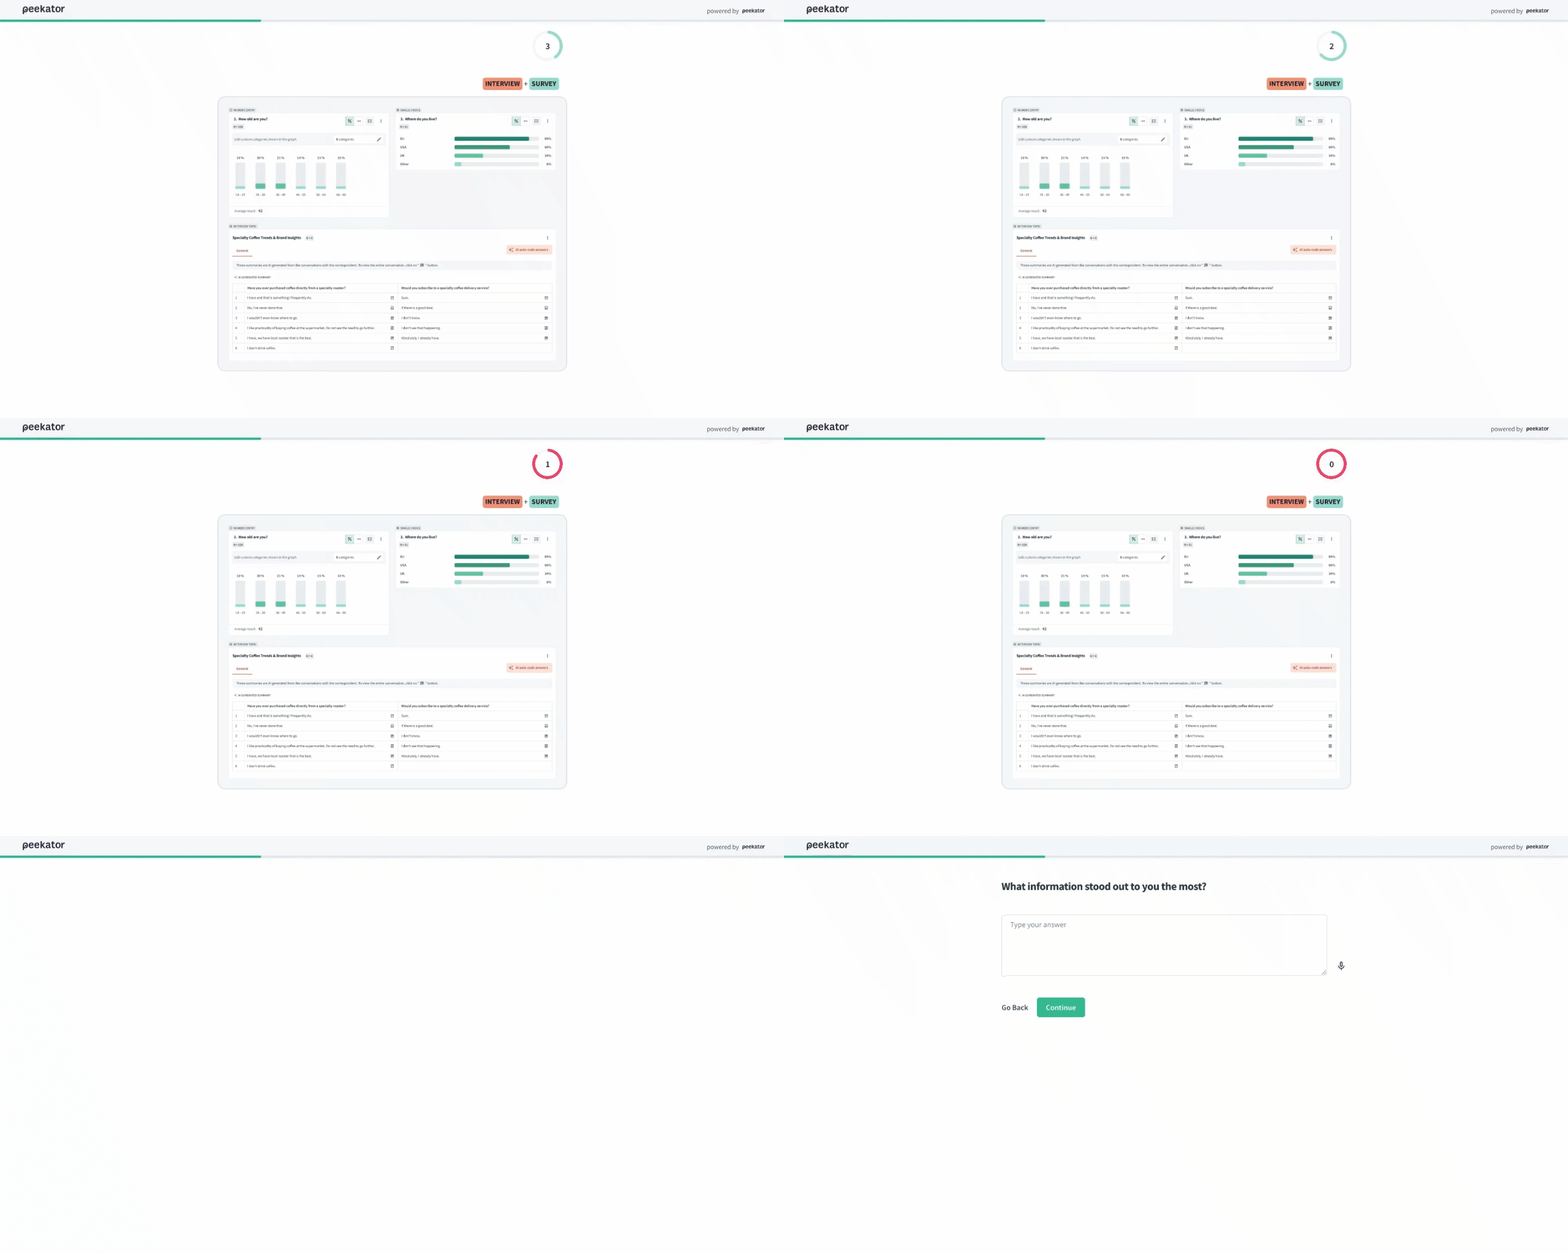
First impressions happen quickly. Sometimes, five seconds is all you need. With the 5 Second Test, you show respondents an image for five seconds. Once it disappears, they answer an open-ended question about what they saw, remembered, or thought.
You could test an ad, a landing page, a new design, a piece of communication, or anything else where that first impression matters. It’s a simple way to see what actually stands out before respondents have time to overthink their answer.
Click Test
Sometimes you don’t want to ask people where they would click. You want to see it. With Click Test, you give respondents an image and ask them to click where they would naturally go to complete a task.
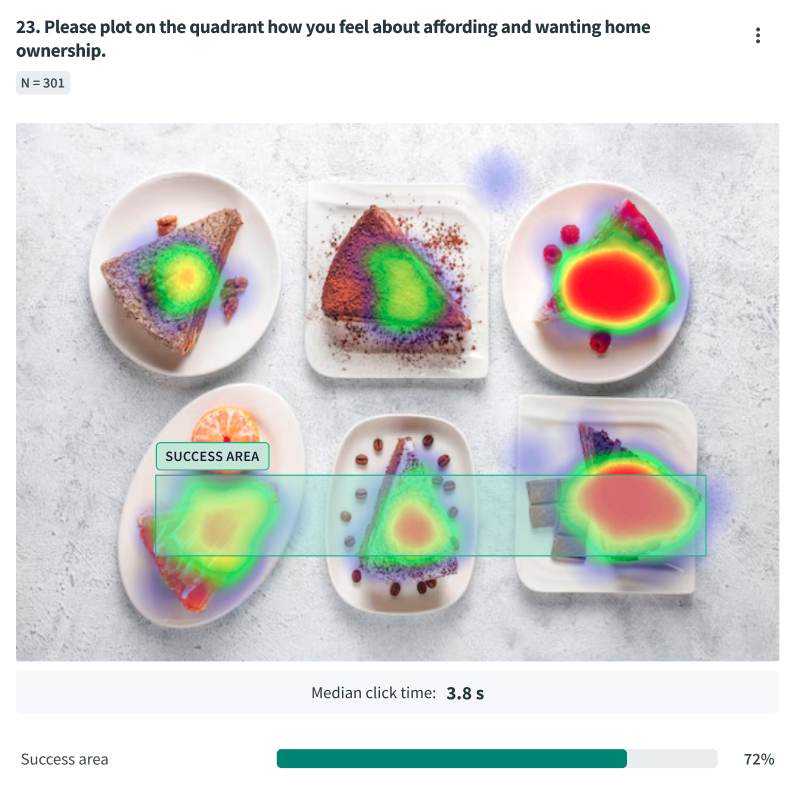
You can see where people clicked, but it goes further than a traditional heatmap. You can define the success area and track how many respondents successfully clicked there.
You can also see the median click time, giving you another clue about how easy or difficult something was to find. So you’re not only seeing where people click, but whether they found the right place and how quickly they got there.
Thanks for reading! We’ll be back soon with more updates, ideas, and inspiration from the world of research.